
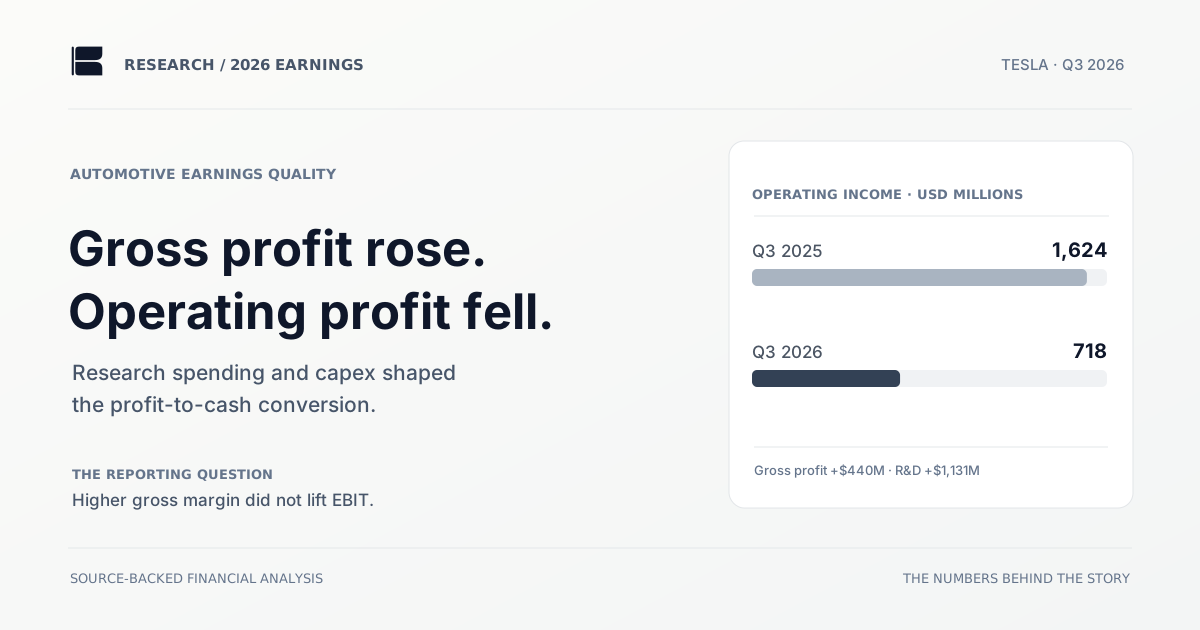
Tesla's third-quarter 2026 results contain an accounting puzzle. Revenue barely changed from a year earlier, while gross profit increased by $440 million. Yet operating income fell 56%, from $1.62 billion to $718 million. The difference is not hidden in an obscure adjustment. It is visible in how much the company spent on research, development and the business infrastructure it is building for its next phase.1
For investors following Tesla as a vehicle manufacturer, an energy company and a developer of autonomous systems, the important question is therefore not just whether automotive gross margin improved. It is how much of today's profit is being reinvested—and how much cash remains after the investments are paid for. The company's September 30, 2026 Form 10-Q and historical filing data offer a more complete answer than a single adjusted earnings headline.1
Tesla earned more gross profit than a year ago. It also spent substantially more on the technologies and capacity meant to generate its future profit.
A stronger gross margin did not translate into stronger earnings
Tesla reported $28.046 billion in third-quarter revenue, compared with $28.095 billion a year earlier. The 0.2% decline means sales were essentially flat. Gross profit nonetheless rose 8.7% to $5.494 billion, lifting GAAP gross margin from 18.0% to 19.6%. That looks like a meaningful improvement in the economics of the products and services sold during the quarter.1
It was not enough to lift operating profit. Total operating expenses increased from $3.430 billion to $4.776 billion, more than three times the $440 million improvement in gross profit. The reported operating profit was $718 million, versus $1.624 billion in Q3 2025. GAAP operating margin fell from 5.8% to 2.6%.1
| Metric · USD millions unless indicated | Q3 2026 | Q3 2025 |
|---|---|---|
| Revenue | 28,046 | 28,095 |
| Gross profit | 5,494 | 5,054 |
| GAAP gross margin | 19.6% | 18.0% |
| Research and development | 2,761 | 1,630 |
| Selling, general and administrative | 2,015 | 1,562 |
| Restructuring and other | 0 | 238 |
| GAAP operating income | 718 | 1,624 |
| GAAP operating margin | 2.6% | 5.8% |
The arithmetic explains the result without relying on a non-GAAP definition. Gross profit added $440 million. Research and development cost $1.131 billion more than a year earlier; selling, general and administrative expenses added another $453 million. Tesla had also recorded $238 million of restructuring and other costs in Q3 2025, which were absent in the 2026 quarter. Together, these changes reconcile the $906 million fall in operating profit.1
The bars reconcile exactly: 1,624 + 440 − 1,131 − 453 + 238 = 718. Lower restructuring costs are a favorable change, not additional gross profit.
What Tesla spent the additional $1.13 billion developing
Research and development is the largest individual driver in the bridge. R&D rose 69%, from $1.630 billion to $2.761 billion, and increased from about 6% of revenue to almost 10%. In the filing's management discussion, Tesla points to spending on its superintelligence initiatives and projects including Optimus, silicon development, batteries and new vehicles. Those programs could become economically valuable, but their expected returns are not measured by the Q3 income statement.1
Sales, general and administrative expenses rose 29%. Tesla attributed much of that increase to stock-based compensation, facilities and software spending, and personnel costs. In the detailed compensation note, group stock-based compensation expense reached $1.165 billion for the quarter, compared with $663 million a year earlier. This is an expense affecting reported profits, though it is not paid out in the same manner as a cash salary; it can also matter for dilution and the value attributable to existing shareholders.1
The distinction between R&D and capex matters. Much of the development effort is expensed through the income statement as incurred. Purchases of buildings, equipment and computing infrastructure typically appear as investing cash outflows and then affect earnings over time through depreciation. A future project can therefore depress this quarter's operating profit through research spending and consume cash for physical assets—without those two amounts being added together as if they were the same cost.
Did Tesla's profitability improve at all?
Yes, relative to the preceding quarter. Tesla's operating margin increased from 1.4% in Q2 2026 to 2.6% in Q3, with operating income rising from $398 million to $718 million. But the broader comparison is less encouraging: the Q3 margin remained 3.2 percentage points below Q3 2025. A recovery from an unusually weak quarter and an improvement over the prior year are different claims.1
Using Clarifo's historical SEC XBRL financials, the margin series can be compared on a consistent GAAP basis over eight quarters. The resulting chart shows several material swings rather than a smooth upward trend. That is one reason a current gross-margin improvement should not automatically be projected into a new steady-state operating margin.
Margins calculated as GAAP operating income divided by reported revenue. Values are rounded to one decimal; fiscal quarters correspond to calendar quarters.
Services grew, while automotive and energy revenue contracted
The sales mix adds another layer to the story. Total automotive revenue declined 3% to $20.560 billion, including lower regulatory credit revenue and leasing revenue. Energy generation and storage revenue fell 16% to $2.881 billion. Services and other revenue, however, rose 33% to $4.605 billion. The relatively flat consolidated total conceals substantial differences in the direction of individual revenue streams.1
Reported revenue categories, not separate operating-profit segments. Automotive includes automotive sales, credits and leasing.
These revenue categories should not be mistaken for three independently disclosed profit centers. Tesla's segment reporting combines automotive with services and other, while energy generation and storage is the second reportable segment. Investors cannot infer standalone operating margins for services from revenue growth alone. The improved gross margin in automotive and services was helped by vehicle cost, revenue mix and other factors described in management's discussion, but the economics of individual initiatives remain less visible.
A $447 million tariff-related gross-profit consideration
A less obvious item in Note 11 deserves attention. Tesla disclosed $526 million of tariff refunds recognized as reductions to energy-storage costs and $260 million recognized as reductions to automotive sales costs. At the same time, it recognized a $339 million reduction to energy-storage revenue for refunds contractually owed to certain customers.1
These reported entries imply a net $447 million favorable effect on gross profit in the quarter, all else equal: $526 million plus $260 million less $339 million. This is a mechanical calculation from the amounts Tesla disclosed, not a company-issued adjusted gross-profit measure. It matters because the entire year-on-year gross-profit improvement was $440 million. Analysts assessing recurring margins should therefore investigate how tariff-related effects intersected with underlying product costs, while avoiding an unsupported claim that every other cost or price effect would remain unchanged in a hypothetical quarter without them.1
Reported gross margin of 19.6% is the GAAP result. The $447 million tariff-related net effect is a derived observation from Note 11, not a published non-GAAP margin. The two should be identified separately in any valuation model.1
Free cash flow tells a different story from operating cash flow
Tesla generated $6.263 billion of operating cash flow in Q3 2026, almost unchanged from $6.238 billion in Q3 2025. On that measure, the company's quarterly cash generation remained resilient despite lower accounting profits. But cash capital expenditure increased from $2.248 billion to $4.732 billion. Free cash flow consequently declined from $3.990 billion to $1.531 billion—a decrease of about 62%.1
The cash-flow bridge is especially revealing. Operating cash flow improved by only $25 million year over year, while cash capex increased by $2.484 billion. The difference explains the $2.459 billion decline in free cash flow. This is a more precise conclusion than saying that weaker car sales were the principal cause of Tesla's cash-flow deterioration.1
The 10-Q shows year-to-date cash flows. Clarifo derives Q3 operating cash and capex by subtracting the six-month totals from nine-month totals. Free cash flow = operating cash flow − cash capex.12
For cash-flow reporting, there is an important technical detail: Tesla's Form 10-Q presents the cash-flow statement on a nine-month year-to-date basis. Clarifo's quarterly dataset derives Q3 operating cash flow and capex by subtracting the six months ended June 30 from the nine months ended September 30. The derived amounts reconcile to the company's quarterly investor update, and the calculation prevents a common error—mistaking nine-month cash flows for a standalone quarter.12
The change in 2026 spending guidance deserves attention
In its Q2 2026 10-Q, Tesla said it expected more than $25 billion in full-year 2026 capital expenditure. The Q3 filing instead describes expected capex as in excess of $20 billion. This is a lower stated threshold, not a commitment to spend exactly $20 billion. The company had spent $13.01 billion in cash capex during the first nine months, compared with $6.13 billion over the same period in 2025.1
Importantly, a lower minimum spending forecast does not establish that the announced investment program will produce higher returns. Tesla's plans span manufacturing, compute infrastructure, autonomous products, battery development, retail and services. The financial question is whether those outlays eventually generate sufficiently large and durable operating cash flows.
Tesla also disclosed three new credit agreements in September 2026, representing aggregate commitments of $30 billion: a $20 billion delayed-draw term loan facility and $10 billion of revolving facilities. These arrangements provide financing flexibility; they are not the same as $30 billion in new borrowing or cash already spent. The filing reported $45.447 billion in cash, cash equivalents and short-term investments at September 30, another reason to examine available liquidity and financing separately from income.1
What the next quarter needs to demonstrate
There are several ways Tesla's investment period could develop. Greater software or autonomous-service monetization might improve high-margin revenue over time. Manufacturing and compute investments could raise productive capacity. Alternatively, further R&D growth, depreciation and equipment payments could limit free cash flow even if vehicle gross margins recover. The current filing does not tell investors which path will dominate.
A useful next-quarter checklist therefore starts with the reporting lines that explain this quarter: R&D and stock-based compensation, automotive and energy revenue mix, disclosed tariff effects, operating cash flow, cash capex and the timing of further financing drawdowns. The most informative sign of improvement would not be just higher deliveries or a larger product roadmap. It would be sustained operating-profit and free-cash-flow recovery after funding the investments required to deliver that roadmap.
For broader context on why infrastructure investment can outpace cash generation, see AI capex is rising faster than cash flow. The discussion here is limited to financial evidence and accounting interpretation, not a Tesla share-price forecast.
- Tesla — original earnings statement and SEC filing. Primary source for the reporting period.
- Tesla — previous SEC Form 10-Q, six-month cash totals. Used to calculate standalone Q3 cash flows by subtracting the six-month cash statement from the nine-month cash statement.
This is an analysis of reported financial statements, not a price target or investment recommendation. All dollar figures are USD; tables may show rounded values.