
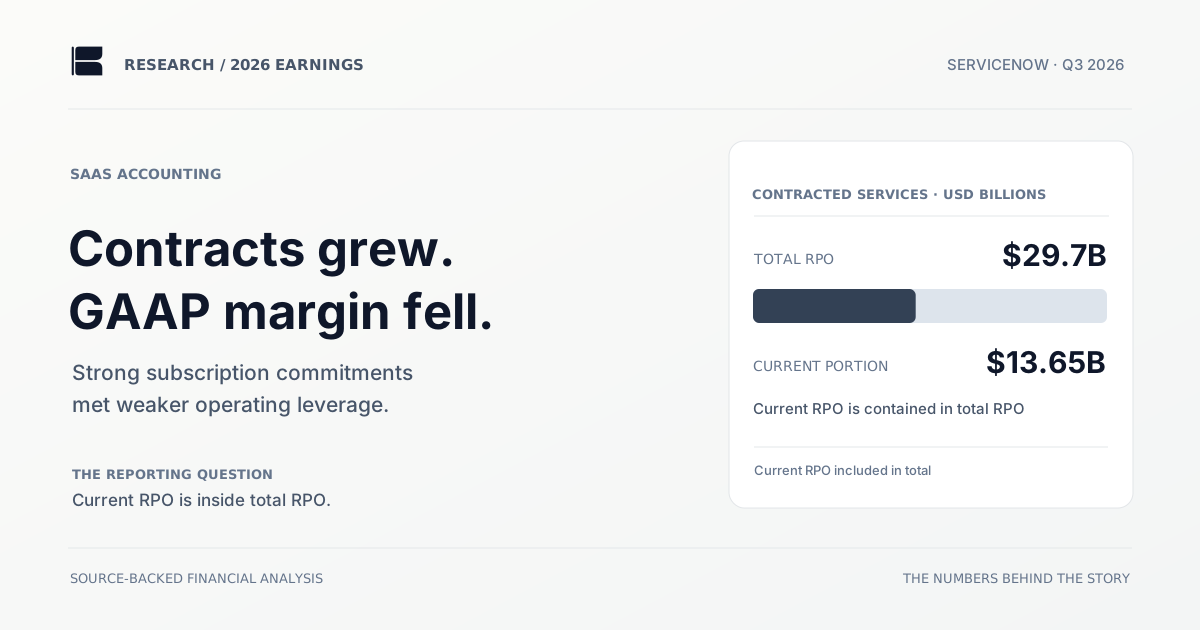
ServiceNow, Inc.: The most interesting contrast in ServiceNow's third quarter is between revenue already delivered and work still promised. The company reported $3.99 billion of subscription revenue, up 21%, while current remaining performance obligations reached $13.65 billion. Both numbers reflect enterprise demand, but they have different implications for revenue timing and cash conversion.1
The eight-quarter context
ServiceNow's subscription revenue rose 21% to $3.988 billion, while consolidated revenue increased from $3.407 billion to $4.106 billion. The eight-quarter revenue history is consistent with a steadily expanding enterprise-software platform rather than a one-off Q3 rebound. But that is only the top half of the financial picture.1
Clarifo's SEC income-statement series shows GAAP operating income declining from $572 million in Q3 2025 to $385 million in Q3 2026. The implied operating margin fell from approximately 16.8% to 9.4%, even as sales grew. The company's filing discloses higher cost of subscription revenue—$1.054 billion versus $666 million—and significant expenses associated with ongoing product development and sales growth. A current RPO total does not establish the return on those costs.1
What the company actually reported
The figures below come from the October 28, 2026 results. A metric defined by management is not automatically identical to a GAAP income-statement line, and guidance should not be presented as realized performance.1
| Metric | Reported figure |
|---|---|
| Subscription revenue | $3.99B |
| Subscription growth | +21% |
| Total revenue | $4.11B |
| Current RPO | $13.65B |
| Total RPO | $29.7B |
Why the RPO distinction matters
Total RPO reached $29.7 billion. Current RPO is the portion expected to be recognized over the next twelve months, subject to the company's accounting policy. The two figures should not be summed together: current RPO is already part of total RPO.1
Backlog trends also reflect the length and composition of customer contracts. A longer renewal can add to total RPO without delivering the same amount of immediate revenue growth. Comparing current and total RPO is more informative than choosing whichever number looks larger.
AI contract value needs its own definition
ServiceNow raised its 2026 AI annual contract value target to $1.7 billion, up 70% since the start of the year. Annual contract value is not a GAAP revenue line. It offers commercial context, but investors still need to establish how much of that demand appears in recognized subscription revenue and cash flow.1
Enterprise software can have attractive economics when new revenue scales over a relatively fixed cost base. That thesis depends on retention, implementation costs, sales efficiency and the margins of newer AI functionality. It is premature to infer AI profitability from an annualized contract figure alone.
Compare GAAP and non-GAAP figures using the company's reconciliation. Keep changes in segment definition, billing schedules, cash collection and period-specific adjustments visible rather than smoothing them away.
What the cash-flow statement adds
Current RPO reached $13.65 billion and total RPO was $29.7 billion. Current RPO is already included in total RPO, so the two must never be added. Both balances measure contracted services yet to be delivered, not cash already received or GAAP profit. Contract duration and the amount of obligations expected to convert within 12 months determine how to interpret their relative growth.1
ServiceNow also raised its AI annual contract value target to $1.7 billion. ACV is a company-defined commercial measure, not a reported income-statement line. Whether it translates into higher cash profits will depend on renewal dynamics, infrastructure costs, support and the gross margin of AI-enabled modules.1
The question investors still need answered
Cash from operations was approximately $839 million, compared with $813 million in the year-earlier quarter; cash capex fell to about $91 million from $235 million. This difference underscores why the company can show weaker GAAP operating profit and still generate a relatively steady cash result. Investors should inspect stock compensation, contract collections and recurring cost trends rather than choosing only the most favorable margin metric.1
Clarifo historical revenue and GAAP operating income are SEC XBRL figures. Current RPO and AI annual contract value are company-reported non-statement metrics with different definitions.
What investors should measure next
Track subscription revenue growth alongside current RPO, billings and cash flow. Use the same currency basis and recognize that a contract-value target is not a confirmed revenue outcome.
The question is active in investor conversations on Reddit. These opinions helped identify a useful angle; they are not the evidence behind the figures. For source-backed historical comparisons, see ServiceNow, Inc. on Clarifo and the original results.
One quarter offers a snapshot, not a valuation verdict. A stronger decision process compares several quarters, identifies any change in reporting definitions and distinguishes accounting profits from cash generation. Where management has issued an outlook, changes in the next release should be compared with the actual results rather than with social-media price expectations.
Current RPO is included in the total RPO amount and should never be added to total RPO. Both figures require their own revenue-recognition timing.
- ServiceNow — original results and financial statements. Primary reported financials, non-GAAP reconciliations where applicable and period definitions. Figures independently calculated from these disclosures are labeled in the surrounding text and figure captions.
Analysis prepared October 29, 2026. Not investment advice.