
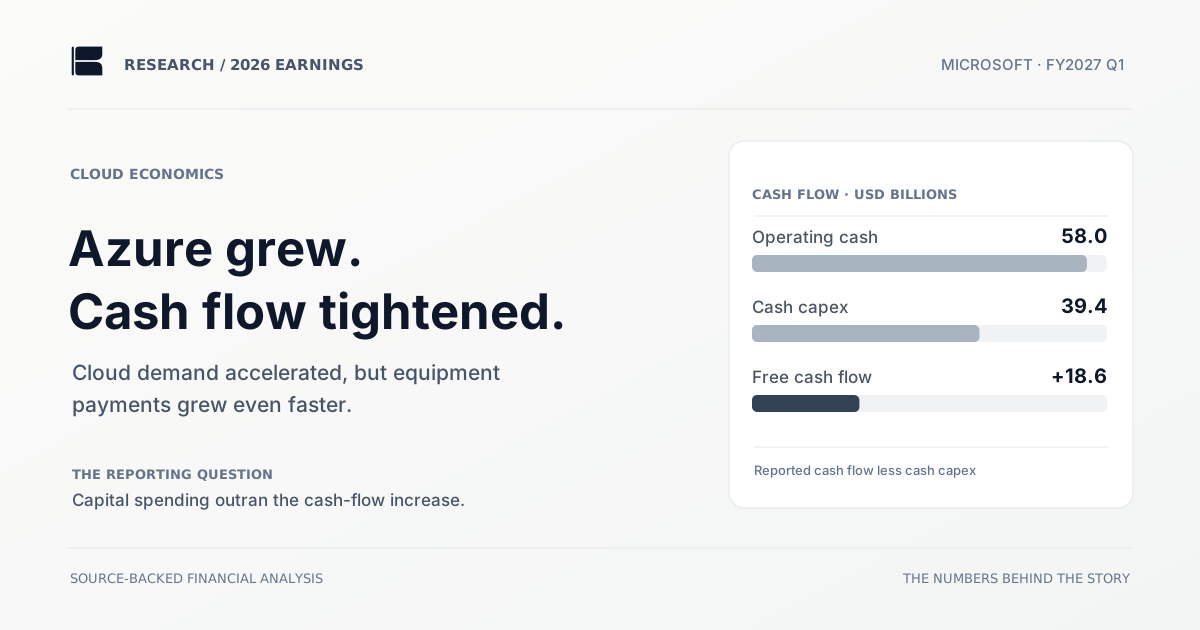
Microsoft Corporation delivered strong September-quarter growth: revenue reached $92.3 billion, Azure grew 48% year over year, and Microsoft Cloud revenue grew 30% to $63.9 billion. But the cash flow statement reveals the other side of the expansion. Cash additions to property and equipment reached $39.4 billion, more than double the $19.4 billion spent in the corresponding 2025 quarter. For an investor evaluating AI investments, the tension between faster demand and faster spending is more informative than either headline alone.1
Microsoft's fiscal first quarter 2027 results, published October 28, 2026, cover July through September 2026. Operating cash flow increased to $58.0 billion from $45.1 billion. Subtracting cash additions to property and equipment gives calculated free cash flow of about $18.6 billion, compared with about $25.7 billion a year earlier. This is not evidence that Azure is unprofitable. It shows how much cash the infrastructure cycle is absorbing today.1
Azure growth is not the same as cash conversion
Microsoft's FY2027 Q1 revenue was $92.279 billion and operating income reached $45.915 billion. The year-earlier quarter brought $77.673 billion of revenue. The revenue expansion is substantial; the unusual question is why free cash flow fell when the business was producing more operating cash.1
The spending bridge is exact at the underlying reported precision. Operating cash flow rose from $45.057 billion to $58.000 billion, a $12.943 billion gain. Cash additions to property and equipment rose from $19.394 billion to $39.367 billion, a $19.973 billion increase. Calculated free cash flow consequently declined from $25.663 billion to $18.633 billion. Neither of those figures measures Microsoft's full contractual commitments for leases and future data-center construction.1
The numbers behind the cloud story
| Financial metric | FY2027 Q1 | FY2026 Q1 |
|---|---|---|
| Revenue | $92.3B | $77.7B |
| Operating cash flow | $58.0B | $45.1B |
| Cash additions to property and equipment | $39.4B | $19.4B |
| Calculated free cash flow | $18.6B | $25.7B |
Why backlog should not be confused with cash
Commercial remaining performance obligations increased 73% to $677 billion. The figure indicates substantial contracted future business. It does not mean that customers have already paid that sum, nor does it measure the cost of delivering the contracted capacity. RPO can span different contract durations and revenue-recognition periods. A strong order book is more informative when considered alongside cash collections, cloud margins and investment commitments.1
Microsoft also introduced updated business segment reporting for fiscal 2027. The company recast some prior-period figures to match the new segments. Analysts constructing a long time series should rely on the recast comparison rather than connecting older Intelligent Cloud disclosures directly to the new Agents and Infra segment without an adjustment.1
Why growth can coexist with falling free cash flow
Data-center investments often require payment before a customer uses the capacity. The related assets then contribute depreciation expense across later periods. Revenue, cash payments and accounting expenses therefore occur on different schedules. Microsoft’s increase in capital expenditure exceeded the gain in operating cash generation during this particular quarter, reducing the cash surplus available after equipment purchases.
That tells us little by itself about lifetime infrastructure returns. A more useful test is whether Azure growth persists, whether new capacity becomes well utilized, and whether operating cash flow eventually grows faster than cash spending. A single quarter may be distorted by the timing of large procurement payments.
Always identify the precise capex definition. Microsoft's “additions to property and equipment” here is a cash-flow line. Total infrastructure investment, lease commitments and non-cash equipment additions may require separate investigation before comparing investment intensity across companies.
What the longer-term data changes
Azure revenue growth of 48% and Microsoft Cloud revenue growth of 30% provide strong operating evidence, but they have different definitions from commercial remaining performance obligations. The $677 billion RPO total includes contracted revenue that may be earned over multiple periods. An investor should compare the rate at which the backlog converts to revenue with equipment utilization and future depreciation, not add RPO to cash balances.1
The group has also changed the presentation of its fiscal 2027 segments. A historical model must use recast periods where available; otherwise a label change can produce a fictional acceleration or decline. The series below is consolidated reported revenue rather than a stitched-together segment history, avoiding that comparison trap.1
The interpretation that needs more evidence
Operating cash flow usually reflects cash receipts and working-capital movements, not just operating margin. Large customer prepayments may support cash temporarily, and equipment purchases may be concentrated in specific quarters. A stronger judgment about AI returns therefore requires several periods of sales, costs, free cash flow and the timing of delivery to customers.
Clarifo's SEC XBRL dataset contains eight quarterly revenue observations and the quarter's cash-flow lines. Microsoft reports cash equipment additions in its cash-flow statement. This chart does not claim to allocate all capex to Azure.
What matters next
Investors should track Azure revenue growth together with cloud profitability, capex divided by operating cash flow, and the conversion of remaining performance obligations into recognized revenue. The discussion about hyperscaler capex on Reddit illustrates the market question, but the financial conclusions here rely on Microsoft's filings.1
For a direct comparison with another large AI infrastructure buyer, see Microsoft versus Alphabet: the AI cash flow gap. The underlying reports and longer-term Microsoft financials can be explored via Clarifo's Microsoft company page.
Cash additions to property and equipment are the cash capex measure used here. Total infrastructure commitments, including non-cash equipment and leases, should be inspected separately.
- Microsoft — original financial results. Quarterly results and disclosures.
Prepared October 29, 2026. Not investment advice.